This task is about comparing theoretical with experimental outcomes.
How to do the task
When two dice are thrown the numbers on top are added together.
| a) | i) |
Do an experiment: throw the dice 36 times to try and find out which sums are more likely to come up.
Record your results in the table below. You may work in pairs for this part.
|
||||||||||||||||||||||||
|
||||||||||||||||||||||||||
|
ii)
|
Complete the frequency table below based on your actual results above.
|
|||||||||||||||||||||||||
 |
||||||||||||||||||||||||||
|
|||
|
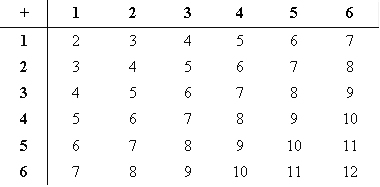
The table below shows all the possible sums you can get when the numbers on the two dice are added together.
Number on Dice One:
|
||
  |
||
| b) |
Using the information above, write in the table below how many times each sum occurs. These give the expected frequency for each number between 2 and 12. Two of them have been done for you (i.e., a sum of 2 occurs just 1 way and a sum of 11 occurs 2 ways).
|
|
 |
||
| c) |
Comment on the overall similarities or differences between the actual frequencies from your experiment in a), and the expected frequencies in the table in b) above.
|
|
| d) |
Give two reasons why the actual frequencies in a) may be different from the expected frequencies in b).
|
|