| a) |
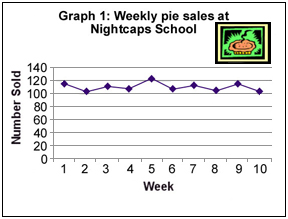
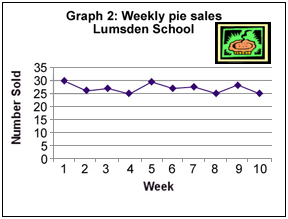
Graphs 1 and 2 show the weekly pie sales at Nightcaps and Lumsden Schools.
Compare the pie sales and the trends in sales between the two schools over the weeks shown.
|

| b) |
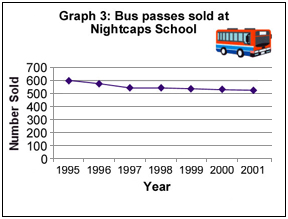
Graphs 3 and 4 show the bus pass sales at Nightcaps and Lumsden Schools.
Compare the bus pass sales and the trends in sales between the two schools over the years shown.
|