This task is about changing states of matter: solid, liquid and gas.
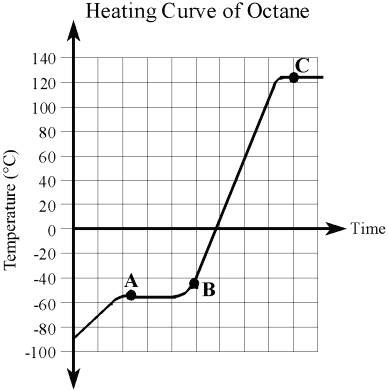
A heating curve is a graph that represents the stages of matter that a substance changes into as heat is added to it. The flat lines on the curve mark where the stages of matter change. The temperature is constant at these transition points.
| This is the heating curve of octane (the main component in petrol). |
 |