Colours of cars I

Colours of cars I

Pencil and paper
Overview
Using this Resource
Connecting to the Curriculum
Marking Student Responses
Further Resources
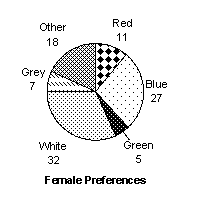
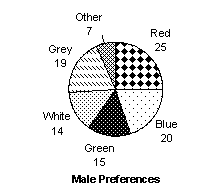
In a survey, 100 females and 100 males were asked which colour of car they liked most.
The results are shown on the two pie charts below.
 

Car colour students prefer

 
a)
 
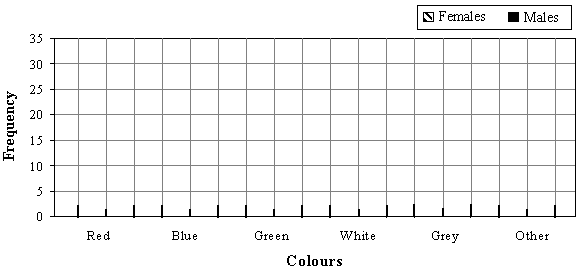
Complete this composite bar graph of the results.

 
Car colour students prefer


b) On which colour were female and male preferences most similar? ____________________
Task administration: 
This task is completed with pencil and paper only.
Levels:
4, 5
Description of task: 
Students study results of a survey about car colours on two pie charts and transfer the data to a composite bar graph. They also answer an interpretative question.
Curriculum Links: 
 
This resource can be used to help to identify students' ability to interpret a pie chart and construct a composite bar graph.
Learning Progression Frameworks
This resource can provide evidence of learning associated with within the Mathematics Learning Progressions Frameworks.
Read more about the Learning Progressions Frameworks.
Answers/responses: 


Y11 (03/2001)

1 mark


2 marks
(all bars correct height to within 1 mm)
or
1 mark
(1-2 errors in bar heights)

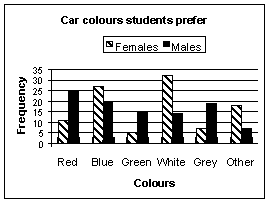
a)

Draws a composite bar graph, and

  • gap between the bars is consistent,
  • male and female bars are always in the same order for each colour, and
  • there are gaps between bars for different colours.


NOTE: Transposing the bar heights for males and females on one colour counts as one error.

easy


2 marks – easy

1 mark – very easy

1 mark

b)

Blue

very easy