Skip to main content
Google Tag Manager
Main menu
About
FAQ
Contact
Privacy
User menu
Register
Login
You are here
Home
Ice cream and temperatures
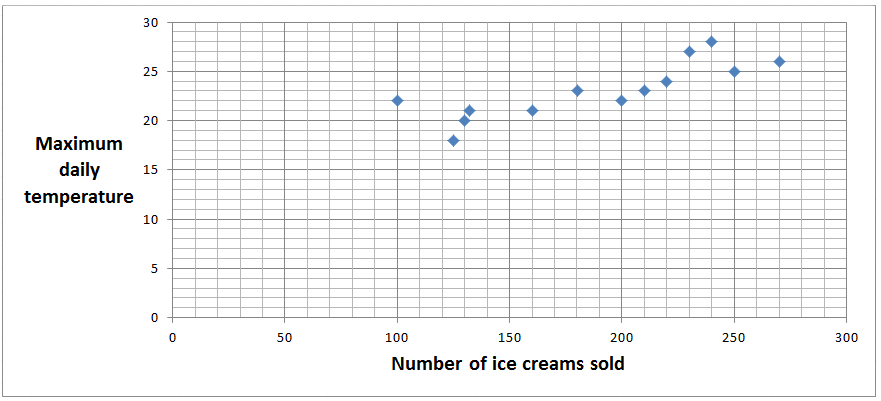
This task is about reading the main idea of a graph.
This graph shows the number of ice creams sold and the maximum daily temperature on different days.
The number of ice creams sold and the maximum daily temperature
Question
Change answer
a) Choose the
best overall statement
about the number of ice creams sold and the daily temperature.
a) Choose the
best overall statement
about the number of ice creams sold and the daily temperature.
Question
Change answer
b) Choose the
statements that are not true
about the number of ice creams sold and the daily temperature.
(Select two)
b) Choose the
statements that are not true
about the number of ice creams sold and the daily temperature.
(Select two)
Question
Change answer
c) Choose the
statements that are about details on the graph
about the number of ice creams sold and the daily temperature.
(Select two)
c) Choose the
statements that are about details on the graph
about the number of ice creams sold and the daily temperature.
(Select two)