
This task is about comparing theoretical with experimental outcomes.
Practical Task
Throw the three coins together. Score a "head" as 1 point and a "tail" as 2 points.
| a) | i) | Add the three scores together, repeat this a total of 80 times and record your results in the tally chart below. | ||||||||||
|
||||||||||||
|
ii)
|
Complete the table below using the information from the tally chart above.
|
|||||||||||
|
||||||||||||
|
b)
|
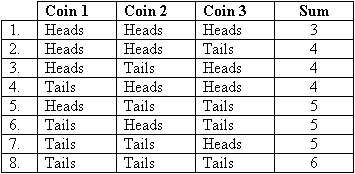
There are eight ways that the coins can come up. They are:
|
|||||||||||
 |
||||||||||||
|
The probability of getting the three coins summing to 3 (i.e., three heads) is 1⁄8.
Complete the table of probabilities. The first one has been done for you.
|
||||||||||||
|
c)
|
Use the table above to predict how many times you would expect to get each of the following sums if the three coins were thrown 80 times.
|
|||||||||||
|
i)
ii)
iii)
iv)
|
A sum of 3? __________
A sum of 4? __________
A sum of 5? __________
A sum of 6? __________
|
|||||||||||
|
||||||||||||
| d) |
Write a statement comparing the expected frequencies in c) with what you actually got in the experiment in part a) ii).
|
|
|
e)
|
Why may the results in a) ii) and c) be different?
Give two reasons.
|
|
|
|
||