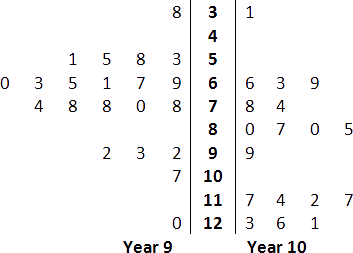
Some students decided to measure the time spent helping at home by Year 9 and Year 10 students. They asked a sample of students to record the time they spent helping at home one night.
They displayed their results on this back-to-back stem-and-leaf graph.
Time spent helping at home (in minutes)

|
|
||
| a) |
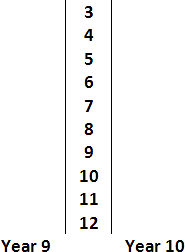
Redraw the graph putting the numbers within each stem in order.
 |
|
|
b)
|
What was the least time spent helping at home by any of the students? __________ minutes
|
|
| c) |
What was the median time spent helping at home by
|
|
|
i)
ii)
|
the 21 Year 9 students? __________ minutes
the 18 Year 10 students? __________ minutes
|
|

