
New Zealand's Unemployment Rate 1989-1997
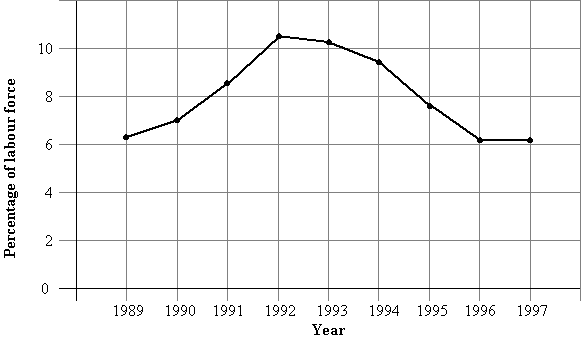
This graph shows the average unemployment rate in New Zealand for each of the years 1989-1997. Answer the following questions about the graph.
| a) |
In which year was the unemployment rate 7 percent? ______________________ |
||||
| b) |
In which two years was the unemployment rate over 10 percent? ___________________ |
||||
| c) |
Which year had the sharpest fall in the unemployment rate? |
||||
|
|||||
|
d) |
Look at the shape of the graph above. Now draw a straight line on the graph to show the average unemployment rate for 1989-1997. |