
This task is about interpreting information on a time-series graph.
The number of bank branches and ATM's
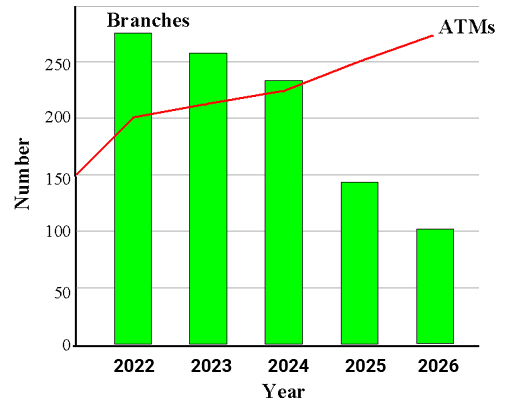
A bank has closed many of its branches and replaced them with automatic teller machines (ATMs).
The graph above shows the number of branches and the number of ATMs the bank had over the last eight years.
Answer the following questions about the graph.
| a) |
About how many ATMs were there in 2023? _______________ |
| b) |
About how many branches closed down between 2024 and 2025? _____________ |
| c) |
Finish this statement.
Between 2022 and 2024 the number of branches ... ____________________________,
but between 2024 and 2026 the number of branches ... _________________________.
|