Skip to main content
Google Tag Manager
Main menu
About
FAQ
Contact
Privacy
User menu
Register
Login
You are here
Home
Swimming pool temperature
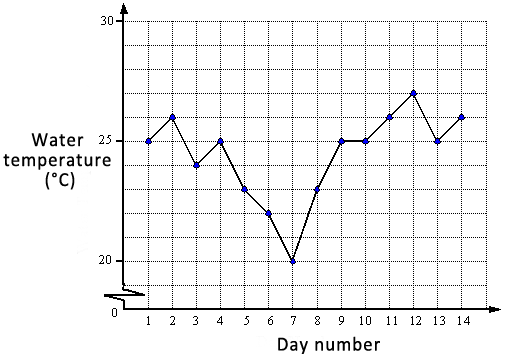
This task is about interpreting a time series graph.
A school caretaker measured the temperature of the water in the swimming pool over 14 days.
This is a graph of the results.
Water Temperature Over 14 Days
Question
2
Change answer
a) What was the temperature on Day Number 3?
ºC
Question
2
Change answer
b) On which day did the pool have the highest temperature? Day number
Question
2
Change answer
c) Which temperature was the most common?
ºC
Question
2
Change answer
d) For how many days was the temperature 23ºC?
days
Question
2
Change answer
e) What happened to the water temperature between Day Number 4 and Day Number 7?
e) What happened to the water temperature between Day Number 4 and Day Number 7?