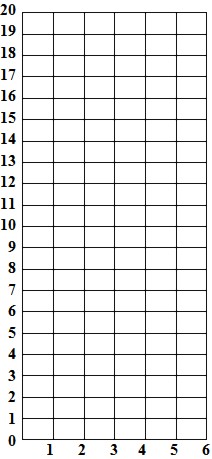
This task is about graphing data of two variables and looking for patterns.
Patrick wants to know if there is a relationship between the number of people at a house and the number of letters delivered to the house. He collects data for 18 houses and puts it in a table.
Number of people per house and the number of letters delivered
| Number of people at a house | 1 | 1 | 2 | 2 | 2 | 3 | 3 | 3 | 3 | 4 | 4 | 4 | 4 | 5 | 5 | 5 | 6 | 6 |
|
Number of letters |
6 |
8 |
7 |
8 |
9 |
8 |
9 |
11 |
12 |
9 |
11 |
14 |
15 |
14 |
16 |
17 |
15 |
19 |
| a) | Draw a scatterplot or any other graph of the data he collected (shown in the table above). |
|
Number of letters delivered to the house
|
|
| b) |
Describe the relationship you can see in the graph between the number of people at a house and the number of letters delivered to the house.
|


