
This task is about collecting and showing data on a graph.
| a) | • |
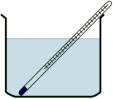
Your teacher will give you a thermometer and a container with hot water in it.
Let this sit for 1 minute to allow the temperature to stabilise.
|
| • | Now record the temperature of the water and write this temperature in the table below at 0 minutes. | |
| • |
Keeping the thermometer in the water, record the temperature changes at 1-minute intervals over ten minutes. |
|
Time (minutes) |
Water Temperature (°C) |
|
0 |
|
|
1 |
|
|
2 |
|
|
3 |
|
|
4 |
|
|
5 |
|
|
6 |
|
|
7 |
|
|
8 |
|
|
9 |
|
|
10 |
|
|
b) |
On the grid below draw a graph to show your results over the 10 minute period. You will need to complete the x- and y- axes. |
||||||||||||||||||||||||||||||||||||||||||||||||||||||||||||||||||||||||||||||||||||||||||||||||||||||||||||||||||||||||||||||||||||||||||||||||||||||||||||||||||||||||||||||||||||||||||||||||||||||||||||||||||||||||||||||||||||||||||||||||||
|
Temperature change of water each minute over 10 minutes
|