This task is about creating a graph of measurement data.
Mount Herbert is 2000 metres high.
The data in the table below shows the progress, after each hour, of two climbers as they climbed to the top of the mountain.
|
Time (hours) |
0 |
1 |
2 |
3 |
4 |
5 |
6 |
7 |
|
Climber 1 distance climbed (metres) |
0 |
500 |
1150 |
1400 |
1600 |
1800 |
1950 |
2000 |
|
Climber 2 distance climbed (metres) |
0 |
600 |
1200 |
1500 |
1700 |
1900 |
2000 |
- |
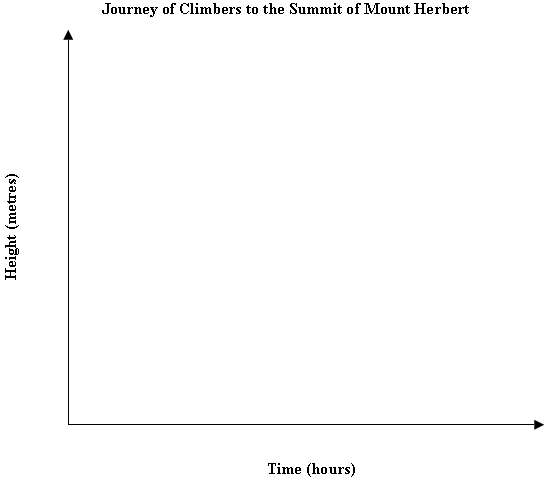
Draw an appropriate graph of the data on the axes below: