This task is about creating a back-to-back stem-and-leaf graph from raw data.
|
Classes 10MV and 10SP had a softball throwing competition. They measured their throws to the nearest metre. Here are their results. |
|
Class 10MV |
Class 10SP |
|
|
31 43 62 38 51
47 26 18 49 73 55 38 66 29 34 58 43 14 44 69 48 60 37 |
47 22 38 35 59
50 17 78 24 43 32 81 36 41 29 53 42 42 58 71 33 43 |
|
a) |
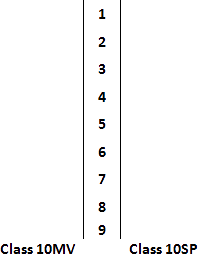
Complete this back-to-back stem-and-leaf graph, to show the results of the throws. You do not need to order the leaves on a stem. |
|
Length of Throws of Class 10MV and 10SP Students
|