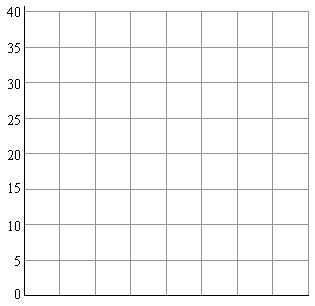
This tasks requires you to construct a time series graph.
|
Ben planted a small lettuce plant and measured its height with a millimetre ruler, at the same time each day.
His results are in the table below.
|
|||||||||||||||||
|
|
||||||||||||||||
Use Ben's results to draw a line graph on the grid below.
- Give your graph a title.
- Label your graph.
- Write in any missing numbers.


