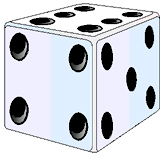
This task is about the best type of graph to show different data.
a) Sivendra threw a dice 50 times and wrote down the number that was facing up after each throw.

|
What kind of graph would be best to display this data? |
||
|
(A) (B) (C) (D) |
Bar graph Line graph Box-and-whisker graph Stem-and-leaf graph |
|
|
b) Petra chose a histogram to graph the heights of people in her younger sister's class.
|

|
Why is a histogram the best kind of graph to display this type of data?
|

