|
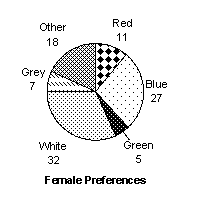
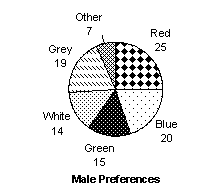
In a survey, 100 females and 100 males were asked which colour of car they liked most.
The results are shown on the two pie charts below.
|
|||||
|
a)
|
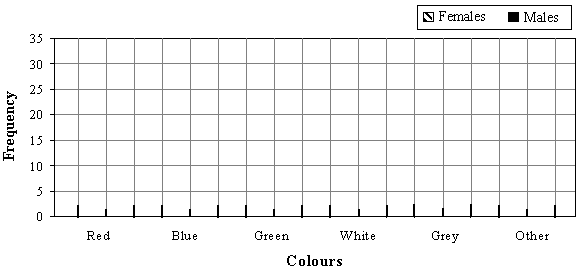
Complete this composite bar graph of the results.
|
||||
|
|
|||||
| b) | On which colour were female and male preferences most similar? ____________________ | ||||


