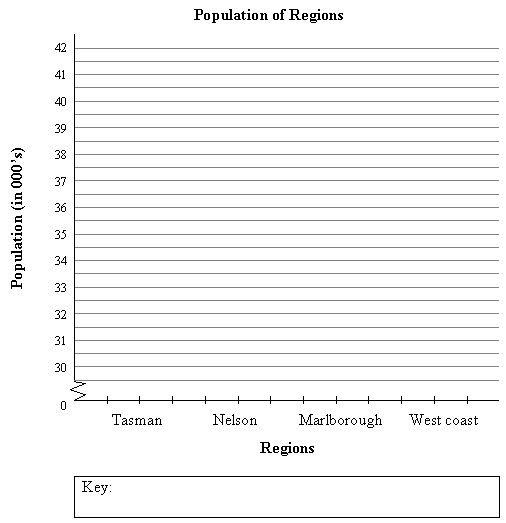
This task is about creating a bar graph to show information.
Table of the population of four South Island Regions in 1991 and 1998
|
South Island Regions |
1991 Population |
1998 Population |
Change |
|
Tasman |
36,400 |
39,600 |
|
|
Nelson |
38,000 |
41,400 |
|
|
Marlborough |
36,700 |
39,700 |
|
|
West Coast |
34,000 |
32,900 |
|
a) |
Complete the change column on the table above. |
|
| b) |
Draw bars on the graph below to show |
|
|
i) ii) |
the 1991 population for each region. the 1998 population for each region. |
|
| c) | Shade the 1991 and the 1998 bars on the graph differently, and give your graph a key. |


