
This task is about showing data on pie graphs.
| a) |
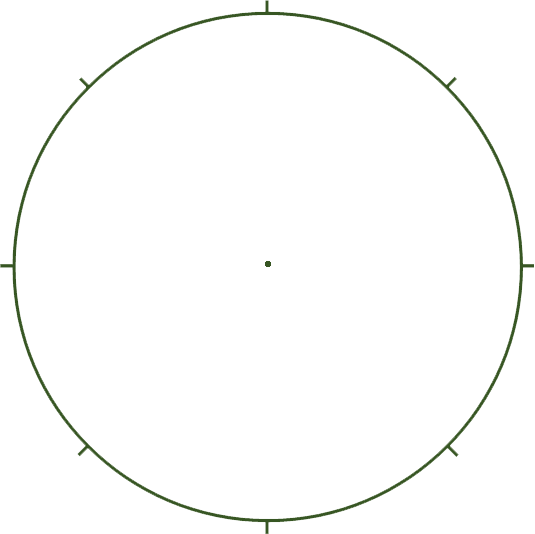
Complete and label the pie graph to show how Samu spent his $160.
|
|
|
Samu's $160
 |
|
| b) |
Complete and label the pie graph to show how Oliver spent his $250.
|
|
|
Oliver's $250
|
|
| c) |
Complete and label the pie graph to show how Lucie spent her $240.
|
|
|
Lucie's $240
|
|