
This task is about interpreting data to make statements about the results.
Sixty students in two classes had ten shots each at a basketball hoop. Each shot was taken from the same position.
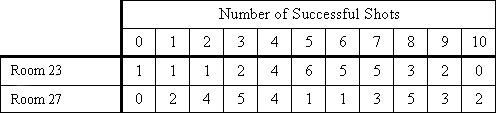
The table shows their results.
|
|

|
a) |
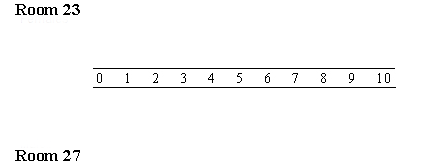
Draw a composite dot plot using the data in the table. The labels of the dot plot have been given. |
|
Number of Successful Shots at a Basketball Hoop
 |
|
| b) |
What is the mode number of successful shots for Room 23? ____________
|
| c) | What is the range of the number of successful shots for the: |
|
i) Room 23? ____________ ii) Room 27? ____________ |
|
| d) | Complete the following sentences. |
|
i) Half of Room 23 got ___________ successful shots or fewer. ii) Half of Room 27 got ____________ successful shots or fewer. |
|
| e) |
From the dot plot make a statement comparing the shape of the graph for Room 23 with the shape of the graph for Room 27.
|