Exam results

This task asks questions about box-and-whisker graphs.

Examination Results in Mathematics and Science


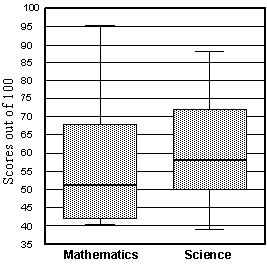
This box-and-whisker plot shows the results of a class of 32 students who sat end-of-year examinations in mathematics and science.


a)
How many students scored 38 percent or below in science? __________
 
 b)
 i) 
 
ii)
 Which subject has the higher median mark? __________ 
 
By how much higher is it? __________
 
 c)
 
 What is the range of marks for mathematics? __________
 
 d)  What fraction of the class scored 50 percent or more in science? __________