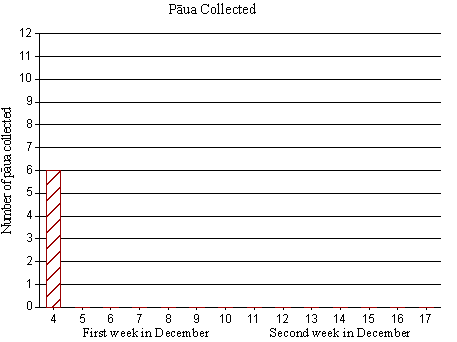
This task is about constructing and interpreting a graph.
Te Hare loves pāua fritters, and dived for two weeks in her summer holidays to get some pāua. She kept a daily diary, as follows:
First week:
Dec 4, collected 6; Dec 5 – 6, didn't go out — water too murky;
Dec 7, got only 3; Dec 8, got 7; Dec 9, got 4; Dec 10, got 5.
Second week:
Dec 11 – 12, really great! — got 10 each day; Dec 13 – 15, wind blowing hard, didn't go out; Dec 16, collected 3; Dec 17, only got 1.
Te Hare started to draw a bar graph of the number of pāua she collected, but she didn't finish it.
| a) | Complete the graph, and answer the questions below. |
|
|
| b) |
On how many days altogether over the two weeks did Te Hare dive for pāua?
__________ days
|
| c) |
On how many days did she collect more than 3 pāua? __________ days
|
| d) |
i) Which was her best week? __________
ii) How many more pāua did she collect in that week than in the other week? _________ more
|
| e) |
What was the average number of pāua she got per day over the 14 days? (Give to 1 decimal place)
__________ pāua
|


