This task is about interpreting a line graph.
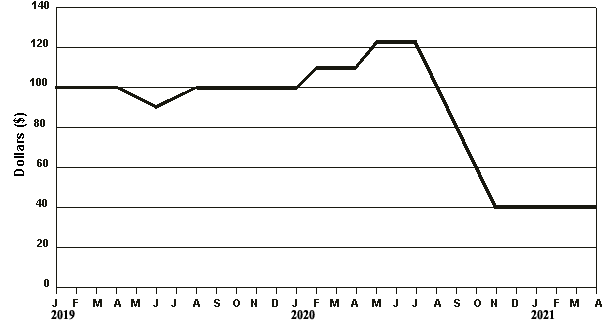
| This graph shows the number of dollars Sam had in his account from January 2019 to April 2021. | |
|
|
|
|
|
|
|
b) |
In which month in 2020 did he have $80 in his account? ____________________
|
|
c) |
Draw a circle around the part of the graph that shows when Sam was taking the most money out of his bank account.
|
|
d) |
What does the flat graph line between November 2020 and April 2021 tell you?
|