
This task is about interpreting a line graph.
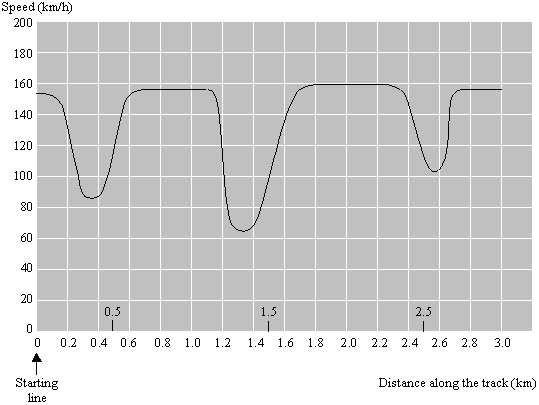
This graph shows how the speed of a racing car varies along a flat 3 kilometre track during its second lap.
Speed of a racing car along a 3 km track (second lap)
| 1. | What is the approximate distance from the starting line to the beginning of the longest straight section of the track? | |
|
(A)
(B)
(C)
(D)
|
0.5 km
1.5 km
2.3 km
2.6 km
|
|
|
2.
|
Where was the lowest speed recorded during the second lap?
|
|
|
(A)
(B)
(C)
(D)
|
At the starting line.
At about 0.8 km.
At about 1.3 km.
Half around the track.
|
|
|
3.
|
What can you say about the speed of the car between the 2.6 km and 2.8 km marks?
|
|
|
(A)
(B)
(C)
(D)
|
The speed of the car remains constant.
The speed of the car is increasing.
The speed of the car is decreasing.
The speed of the car cannot be determined from the graph.
|
|
|
4.
|
Here are pictures of five tracks:
Along which one of these tracks was the car driven to produce the speed graph shown earlier?
(Circle one)
|
 |