This task is about plotting a graph from a chart.
|
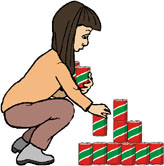
Abby is stacking baked bean cans for a supermarket display.
The table below shows the total number of cans she uses for stacks of different heights.
|
 |
| Height of stack | 1 | 2 | 3 | 4 | 5 | 6 | 7 | 8 | 9 | 10 | 11 | 12 |
| Total number of cans in the stack | 1 | 3 | 6 | 10 | 15 | 21 | 28 |
|
a)
|
Complete the table above to show the total number of cans in each stack.
|
| b) |
Describe the rule you used to complete the table.
|
| c) |
Use the information in a) to plot the points showing the total number of cans in each stack up to 7 cans high.
|
The relationship between the Number of cans used and the Height of each Stack

Number of cans high

