
This task is about fair testing and plotting results from a data table.
An experiment was set up to compare the rate of cooling of a plasticene sphere and a plasticene cube.
This is what was done:
- Four shapes were made out of plasticene; two cubes and two spheres.
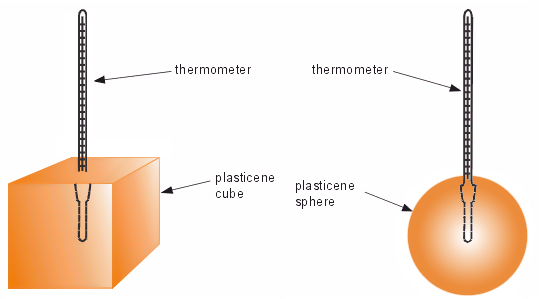
- A thermometer was pushed inside each shape to measure the temperature throughout the experiment. (See the diagrams below).
- A container of hot water was used to heat up the shapes.
- The shapes were removed from the hot water and allowed to cool for 25 minutes.
| a) |
Why were two of each shape used?
|
| b) |
What are three variables that should have been kept the same in this experiment?
|
| c) |
The results of the experiment are shown on the table below.
Use the data to plot a graph of the results.
|
|||||||||||||||||||||||||||||||||||||||||||||||||||
 |
||||||||||||||||||||||||||||||||||||||||||||||||||||
| d) |
Explain the results.
|
|||||||||||||||||||||||||||||||||||||||||||||||||||