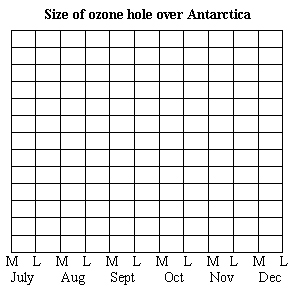
This task is about reading information from a graph.
Each year an ozone hole develops over Antarctica. An ozone hole is defined as an area in which the concentration of ozone is less than 220 Dobson Units. The following data was recorded in one year.
| Size of Ozone Hole in Millions of Square Kilometres by Month | |||||||||||
|
Month
|
Mid
July
|
Late
July
|
Mid
Aug
|
Late
Aug
|
Mid
Sept
|
Late Sept
|
Mid
Oct
|
Late
Oct
|
Mid
Nov
|
Late
Nov
|
Mid
Dec
|
|
Size of ozone hole
(million km2)
|
0
|
1
|
3
|
12
|
22
|
23
|
16
|
11
|
8
|
4
|
0
|
| a) | Draw a line graph for this data on the grid below. Put in the measurement units. |
 |
|
| b) |
When does the ozone hole first appear? ______________________
|
| c) |
Write a statement summarising what the graph shows.
______________________________________________________________________
______________________________________________________________________
______________________________________________________________________
|
| d) |
Sometimes an ozone hole develops faster, covers the same area, and disappears more slowly than the ozone hole you graphed above. Draw a line on your graph (in a different colour) to show this.
|
| e) |
Give two reasons why the development of an ozone hole is of concern to New Zealanders.
1. _____________________________________________________________
2. ____________________________________________________________
|

