

This task is about making and reading a graph.
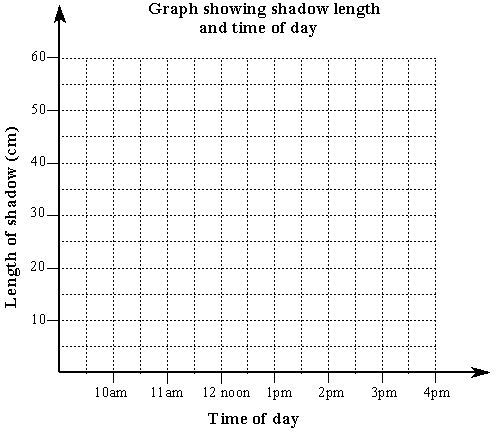
One sunny day in February a group of students measured the length of the shadow made by a stick at different times during the day. Here are their results:
| Time of day |
Length of shadow, in
centimetres (cm) |
| 10 a.m. | 53 |
| 11 a.m. | 37 |
| 1 p.m. | 20 |
| 1.30 p.m. | 18 |
| 2 p.m. | 20 |
| 3 p.m. | 26 |
| 4 p.m. | 37 |
|
a) |
Draw a line graph to show these results. |
|
 |
||
| b) | From the graph you have drawn answer the following questions. | |
|
i) ii) |
How long would the shadow length be at 12 noon? ____________ cm What do you notice about the time of day and the length of the shadow? |
|
| c) |
What causes the shadow length change during the day?
|
|
 |
||
| d) |
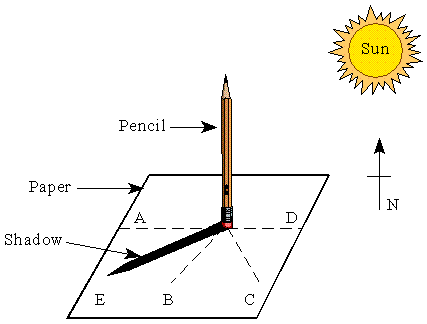
Some students made a simple sundial using a pencil and a sheet of paper as shown above. Their sundial made the shadow E at 9:00 a.m.
Which dotted line shows where the shadow will fall at 11:00 a.m.?
|
|
|
(A) (B) (C) (D) |
A B C D |
|