This task is about using data to find out more about earthquakes.
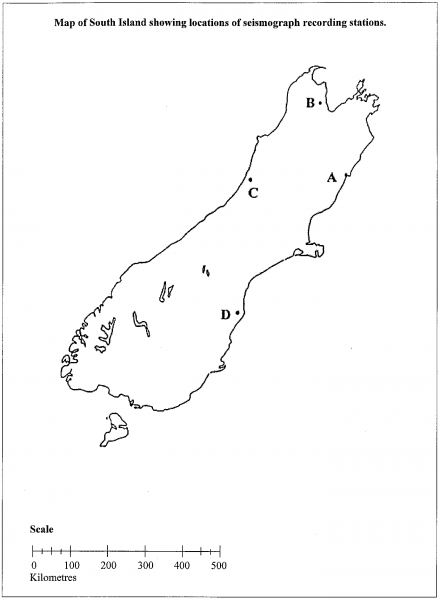
An earthquake struck the South Island of New Zealand about 10:17 a.m. yesterday morning. Below are the seismograph records from three different recording stations; A, B, and C. (See map of the South Island for their location).

| a) |
For each station measure (in millimetres) the distance between the beginning of the P wave and the beginning of the S wave.
Station A: distance between P and S wave = __________ mm.
Station B: distance between P and S wave = __________ mm.
Station C: distance between P and S wave = __________ mm.
|
||||||||||||||||||||||||||||||||||||
| b) | The distance between the P and the S wave, i.e., the information from part a) can be used to calculate how far each station was from the epicentre of the earthquake. Use Table I below to work out these distances. | ||||||||||||||||||||||||||||||||||||
|
|||||||||||||||||||||||||||||||||||||
|
i) Station A was __________ km away.
ii) Station B was __________ km away.
iii) Station C was __________ km away.
|
|||||||||||||||||||||||||||||||||||||
| c) |
Use the distances you calculated in b) above, and the scale on the map of the South Island to show where the epicentre of the earthquake was located. Use a compass to find this point on the map of the South Island, then mark this point with an X.
|
||
| d) |
Another seismograph recording station which is further away from the epicentre than A, B, or C is located at point D in the South Island (see map). In the space below draw a recording that could have come from this station, and label the P and S waves. Your drawing only needs to be an approximation of such a recording.
|
||
|
 |
||
| e) | Use the data from Station A to complete the statements to calculate the magnitude of this earthquake. | |
|
i) Use Table I to calculate the time difference between the arrival of the P and S waves for Station A.
Time difference = __________ seconds
|
||
|
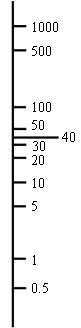
ii) Measure the maximum amplitude of the S wave (on the seismograph record) in Station A in millimetres.
Amplitude of S wave = __________ mm
|
||
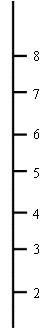
| iii) On the diagram below draw a line between these two points to find the earthquake's magnitude. | ||||||||
iv) What is the magnitude of this earthquake? __________
|
||||||||