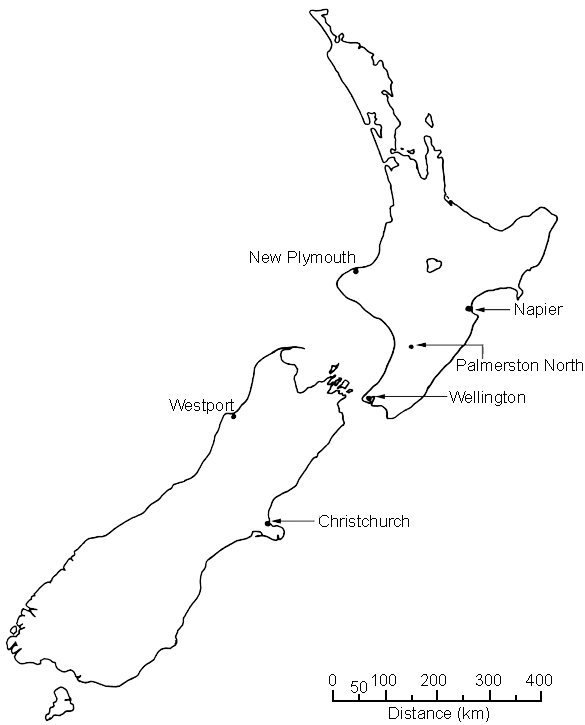
This task is about calculating and plotting data to find the epicentre of an earthquake.
An earthquake struck central New Zealand at about 11:23 a.m. yesterday morning. The time difference between the arrival of the P and S waves can be used to find the epicentre of this earthquake.
| Relationship between time difference and distance | ||||||||
| Time between P and S waves (seconds) | 12 | 15 | 18 | 22 | 26 | 30 | 35 | 37 |
| Distance (km) | 100 | 120 | 150 | 175 | 200 | 270 | 325 | 350 |
|
a)
|
Use this information to complete the table below which shows data collected from seismographs in three different cities.
|
||||||||||||||||||||||
|
|||||||||||||||||||||||
| b) |
Use the distances you calculated, and the scale, to show where the epicentre of the earthquake was located. Use a compass to find this point and mark on the map with an X.
|
||||||||||||||||||||||
 |
|||||||||||||||||||||||

