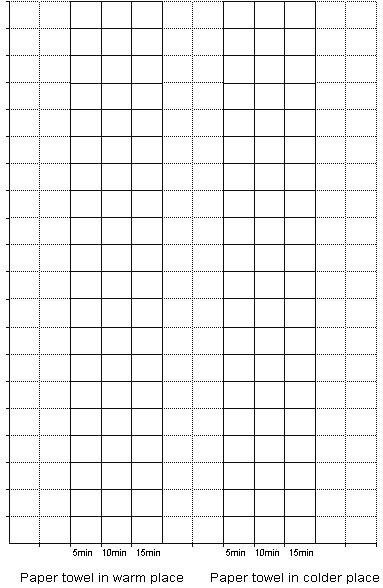
This task is about investigating melting.
How to do this task
- Get two paper towels.
- Use a ruler and biro to draw squares which are 2 cm × 2 cm.
- Place one paper towel in a flat warm place, and the other in a flat colder place.
- Place an ice cube in the middle of each paper towel.
- Draw around the edge of the water stain after 5 minutes. Repeat this after 10 minutes and 15 minutes.
| a) |
Complete the chart of your results.
Remember that the number of squares covered by water after 10 minutes includes those squares covered after 5 minutes.
|
||||||||||||
|
|||||||||||||
| b) |
Finish each graph by colouring in the number of squares that were wet on each paper towel.
|
||||||||||||
 |
| c) |
Look at both graphs. Describe the main difference between the graphs.
|
| d) |
Explain why there was a difference in your results.
|

