
This task is about designing and carrying out a fair test.
Part 1 Observations / preparation This part of the task is about using observations to make a prediction. Obtain four (4) different paper towels and look at them carefully.
| a) |
Fill in the first three columns of the table below.
|
|||||||||||||||||||||||||||||||||||||
|
Table 1: Data collected for four (4) different paper towels
|
||||||||||||||||||||||||||||||||||||||
|
Now that you have looked at the pattern of fibres, you can answer the following questions. |
||||||||||||||||||||||||||||||||||||||
| b) | i) |
Prediction: Which paper towel do you think would absorb the most water?
|
||||||||||||||||||||||||||||||||||||
| ii) |
Explain why you chose that paper towel.
|
|||||||||||||||||||||||||||||||||||||
|
Part 2 Planning a fair test
This part of the task is about planning a fair test. |
||||||||||||||||
| c) |
Number the steps 1 – 6 (in the last column) to show the correct order that can be used to carry out a fair test on the best mopper upper paper towel.
The first step is identified for you.
|
|||||||||||||||
|
d) |
What are you measuring in this investigation? |
|||||||||||||||
| e) |
What are you changing that will affect your measurements?
|
|||||||||||||||
|
Use the steps above in the order that you identified to carry out the investigation. Record your data in columns 4 and 5 of the table in Part 1.
You used the steps to carry out a fair test but it was not fair. A part of the instruction for one of the steps was left out as well as a complete step.
|
||||||||||||||||
| f) |
What part of an instruction or step was left out, making this investigation not a fair test?
|
|||||||||||||||
|
Part 3 Reporting the results
This part of the task is about communicating your results. |
|||
| g) |
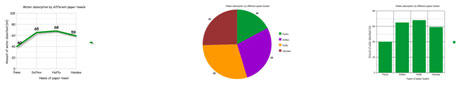
Circle the type of graph you will use to show the data recorded in column 5.
|
||
 |
|||
| h) |
Why did you choose this graph?
|
||
| i) |
What does a graph show that information in a chart does not?
|
||
|
Show the teacher which graph you will use before you graph the data. |
|||
| j) |
Use the information in the column 5 of the table to draw your graph in the box that follows. The title has been provided for you.
|
||
|
|||
|
Part 4 Using the results This part of the task is about interpreting the results. |
||||||
| k) |
Use the graph to rank the paper towels in order from the best to the worst at mopping up spills.
|
|||||
| l) |
i) Was your prediction correct? YES / NO (circle one)
Return to Table 1 in Part 1. Look closely at the pattern you described in column 3 and the amount of water absorbed by each paper towel in column 5. |
|||||
|
ii) What do you notice about the patterns you described in column 3 (the table in Part 1), how much water the paper towels absorb and your prediction?
|
||||||
| m) |
Why might people want to know about the absorbency properties of paper towels?
|
|||||
