Heating octane

This task is about changing states of matter: solid, liquid and gas.
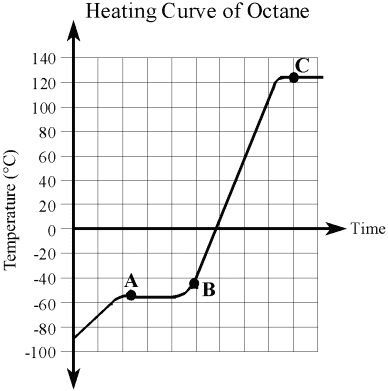
A heating curve is a graph that represents the stages of matter that a substance changes into as heat is added to it. The flat lines on the curve mark where the stages of matter change. The temperature is constant at these transition points.
 
This is the heating curve of octane (the main component in petrol).
graph showing the heating curve of octane
a) i)
What is the temperature of the octane at the start of the investigation? __________°C
  ii)
Is the state of the octane a solid, liquid, or gas at the start of the investigation?
 
_______________
 
b)
At what temperature does the octane begin melting? __________°C
 
c)
At what temperature does the octane begin boiling? __________°C
 
d)
What two states would you observe at point A?
 
1. ____________________                    2. ____________________
 
e)
What state would you observe at point B? ____________________
 
f)
What two states would you observe at point C?
 
1. ____________________                    2. ____________________
 
g)
Describe what is happening to the particles when the octane becomes liquid. The particles:   


h)
Describe what is happening to the particles when the octane is rapidly boiling. The particles: