Measuring volume with accuracy

Measuring volume with accuracy

Pencil and paper
Overview
Using this Resource
Connecting to the Curriculum
Marking Student Responses
Working with Students
Further Resources
This task is about measuring accuracy of equipment.

In groups of 3:

  1. Weigh each cylinder/beaker and write this in the table provided (column 2).
  2. Measure 100 mL of cold water into each piece of equipment.
  3. Weigh the piece of equipment with the water in it, and fill in columns 3,4 and 5.
  4. Repeat steps 1-3 four more times.
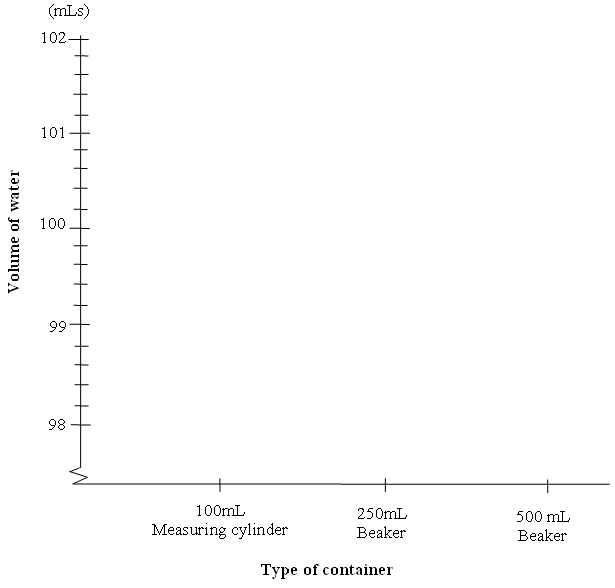
  5. Plot results from column 5 onto the scatter graph.
  6. Discuss the patterns with your group, then answer the two questions, c)i) and ii).
NOTE: 1mL of water weighs 1g
 
a)
1
Equipment
2
Mass of equipment (g)
3
Mass of equipment & water (g)
4
Column 3 - Column 2 = Mass of water (g)
5
Difference from 100mL
Measuring cylinder
 
Trial 1
Trial 2
Trial 3
Trial 4
Trial 5


250 mL beaker
 
Trial 1
Trial 2
Trial 3
Trial 4
Trial 5


500 mL beaker
 
Trial 1
Trial 2
Trial 3
Trial 4
Trial 5


b)
 
Enter the results from Column 4 to complete the scatter plot.
 

                                                   Mass of water in different containers
 
c)
i)  Which is the most accurate piece of equipment? ______________________________
 
  ii) Why do you think this piece of equipment was the most accurate?


Task administration: 
Equipment
Measuring cylinder; 250mL beaker; 500mL beaker; digital balance; water; calculator.
  • This is a group assessment. Have students work in groups of three.
  • 250mL and 500mL beakers are used because it allows students to measure to the 100mL mark whereas the 100mL beaker only has gradations to the 80mL mark.
  • Teachers need to talk through the task before the students begin. They need to ask questions such as "In each column, what are we going to fill in, and why?", "What information are we trying to get at the end?", and "Why do we need to do 5 trials?"
  • Check that students are aware that 1 mL of water weighs 1g.
  • Students should note the differences of the gradations on the sides of the three pieces of equipment.
  • Each student should be responsible for measuring the water into one of the pieces of equipment for all five trials for consistency of measurement.
  • Students record measurements into the table and then complete the scatter graph.
  • Students use the scatter graph to identify the pattern.
  • Students may need to alter the scale of their scatter graph depending on their results.  An outlier can be ignored if it changes the scale to a larger degree and the pattern cannot be seen clearly.
  • Any big variations (outliers) in measurements should be noted. Students could redo the measurement, or talk about possible reasons for the variation.
  • Monitoring conversations during the activity provides evidence of student understanding.
Level:
5
Description of task: 
Task: Measure 100mL of water into three different pieces of equipment. Weigh the result and calculate the precision of using that piece of equipment. Assessment focus: measuring and evaluating the accuracy of equipment.
Curriculum Links: 
Science capabilities
The capabilities focus is brought about by the conversations you have and the questions you ask 
 
Capability: Gather and interpret data
This resource provides opportunities to discuss the importance of precise observations and measurement when gathering information.
Science capabilities: 
Answers/responses: 
 
a)


Answers will vary.  Check that calculations are correct.

b)


The scatter plots are likely to be closer together and have smaller gaps between them for the measuring cylinder compared to the 250mL beaker. The 500mL beaker is likely to have the widest range of plots with the most gaps. For example:

c)

i)

ii)

Answers should reflect students' results. The closeness of the gaps between the plots shows the consistency of measuring and the shorter the range of the plots (hopefully closest to the 100mL mark) shows the accuracy of the equipment. The measuring cylinder is the most likely correct answer if their measuring is accurate.

The measuring cylinder has more gradations than the 250mL and the 500mL beakers so it will be easier to get the water closer to the 100mL mark.
Other answers could include:

  • reference to less surface area in the measuring cylinder for any error to be amplified; or
  • any other mention of the relationship between the volume of the water and the linear scale.
 
Trialled on 6 Year 10 students, April, 2009.
Teaching and learning: 

This resource is contextless. It should be used in conjunction with a task that requires accurate measurement of volume of water.

Understanding about science
Implicit in this resource are some important Nature of Science ideas related to the strand Understanding about science. While the activity could be regarded as essentially mathematics, if teachers frame the activity with a Nature of Science focus, students will understand the importance in science of measuring carefully, replicating investigations, and selecting the most appropriate equipment or scale.

  • In many investigations, it is important to measure carefully so the pattern that is recorded is correct. In this activity a small error in the measurement equates to a significant error when it is compounded by the volume of water.
  • Repeating a test as many times as possible helps to obtain an accurate pattern and negate outliers. In this activity, repeating the measurements provides more evidence about which equipment is the most accurate.
  • The relationship between mass and volume of water is not accidental. Scientists determine measuring protocols/scales. For example:
    1cm x 1cm x 1cm = 1 cubic centimetre = 1cm3 = 1 millilitre (mL) = 1 gram (g)
    10cm x 10cm x 10cm = 1000 cubic centimetres (cm3) = 1 litre (L) = 1 kilogram (Kg)

In this task there are two aspects that impact on the accuracy of the equipment:

  • The length of the linear scale;
  • The surface area of the water.

Two other aspects relating to reading the scale may also affect the accuracy of measurements taken:

  • The meniscus;
  • The angle at which the water surface is viewed.

To measure accurately students need to be aware of the meniscus and line up the lower water level line against the 100mL gradation. Students should read the measurement at eye level and ensure they line up at the same place each time to avoid parallax error.

Diagnostic and formative information: 
  • Some of the trial students obtained measurements which showed the pattern but they could not use the information to answer the questions, because they had not read the instructions before they began.
  • Some students found it difficult to recognise which measurement was closest to the 100mL mark, for example whether 98.18 or 102.27 is closer to 100.
  • In the trial, students talked to each other about the measurements and in one group where one measurement was really different they knew who needed to do their measurement again (recognising rogue results). There was also conversation about how the outlier could have occurred.
Next steps: 
Improving reliability
To gain more reliable results, all of the groups’ results could be plotted on one scatter graph. This would provide more replications and improve confidence in the results.

Degree of error
Students could look at the relationship of volume and the linear scale and how that relates to the amount of error. For example, measuring the inside base of each of the pieces of equipment using the formula πr 2, and multiplying it by the difference between the actual and intended measure (column 5 on students’ table) will give an indication of the amount of error that could occur between the pieces of equipment.

Measurement scales
Students could explore other measuring equipment, e.g., rulers, thermometers, light metres, pipettes, digital scales, etc.


The mathematics bank is a source of other measuring resources.