Plotting star positions
Students plot and interpret star movements and positions in the night sky
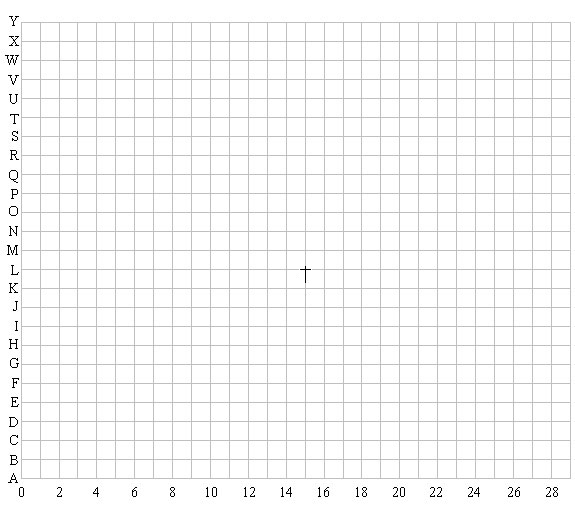
In the early evening John was looking south at the stars in the night sky. He noted the positions of three stars and then wrote down some co-ordinates for plotting on graph paper. He then worked out the co-ordinates of the three stars 3 hours later, and then 6 hours later, that night.
|
Star |
Position at start |
Position after 3 hours |
Position after 6 hours |
|
Star A |
(10,J) |
(10,N) |
(13,Q) |
|
Star B |
(6,N) |
(10,T) |
(17,U) |
|
Star C |
(20,U) |
(24,Q) |
(24,G) |
a) Plot these star positions on the grid below and label the stars A, B, and C.

| b) | i) |
Using
 as the centre use a compass to draw an arc through each set of the three stars labelled A. as the centre use a compass to draw an arc through each set of the three stars labelled A.
Repeat this for stars labelled B and C.
|
| ii) |
On each curve draw an arrowhead to show the direction of apparent movement.
|
| c) |
Why do the stars appear to change position in the night sky?
|
|
| d) | i) |
Calculate the angle between when John first noticed, and when he last noticed, the star which is labelled B.
The angle between the first and the last position of this star is _________ degrees.
|
| ii) |
If the time between these readings is 6 hours, how long would it be for this star to "appear back in a similar position" in the night sky?
_______________ hours
|
|
| e) |
The point
 marked on the map is known as the South Celestial Pole. This point is directly above the South Pole. marked on the map is known as the South Celestial Pole. This point is directly above the South Pole.
How do the patterns of star movement show this?
|
|

