Powders

Powders

Pencil and paper
Overview
Using this Resource
Connecting to the Curriculum
Marking Student Responses
Working with Students
Further Resources
This task is about designing and carrying out an investigation of various powders.
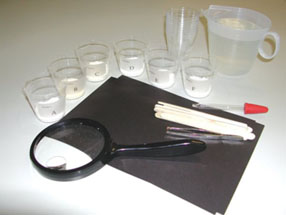
Photo source: NEMP


Powders – Team instructions

Team instructions

  1. Do this activity as a team so that everyone is taking part.
  2. Talk about what you will do to examine each powder.
  3. Design a chart for showing the properties of each powder.
  4. Try to find out at least 3 properties for each powder, and show them on your chart.
  5. After you have examined each powder, write down what you think it is.

You have black paper for putting powders on so that you can examine them more easily. You also have spatulas, tweezers, hand lenses, eye droppers for putting water with the substances, and some empty beakers.

DO NOT TASTE ANY POWDER


Task administration: 

This task can be completed with pencil and paper and other equipment.

Equipment:

Blue pen; teaspoon of powders A = Ajax, B = citric acid, C = flour, D = washing powder, E = salt, and F = baking soda, in sample cups labelled A,B,C,D,E,F; instruction card (provided); jug of water; red pen; 2 pairs of tweezers; 2 hand held lenses; ruler; 12 ice block sticks; 6 sample cups; 2 eye droppers; team answer sheet; 6 teaspoons; 12 sheets A5 black paper

  • Before team arrives, put a teaspoon of each powder in the appropriately labelled sample cups.
  • Students carry out the this NEMP task in groups.
  • The assessor carried out the assessment by observing students’ work, and recording their responses.
Read:
In most homes you will find a lot of different kinds of powders that are used for various purposes.
We usually know what the powders are by the labels on their packets or containers.
Imagine what it would be like if a whole lot of powders were in the same kind of containers, and they didn’t have name labels.
 
How could you tell them apart?
 
I have six containers with different powders that are found around most homes, but the labels don’t say what they are. They only say A, B, C, D, E, F. I want your team to examine the properties of each substance, and to try to decide what it might be. You have hand lenses, tweezers, and water. You can use any methods except one: you must not taste them. I also want your team to design a chart. On your chart I want you to try to show at least three properties of each substance, and to write down what you think the substance is.
 
You will need to think carefully about how to set out the chart.
Here are your instructions.
 
[Place instructions card in front of students, and read it to them. Allow up to 15 minutes for team activity.]
 
To finish off, I would like you to show me your chart, and tell me what you found.
Each person in the team is to have a turn at describing the results.
Level:
4
Description of task: 
In this NEMP task students discuss observations of six unknown common household powders. They design a chart for results, find properties for each, and identify what each powder is. Assessment focus: identifying substances; teamwork.
Curriculum Links: 
Science capabilities
The capabilities focus is brought about by the conversations you have and the questions you ask.
 
Capability: Gather and interpret data
This resource provides opportunities to discuss different methods for gathering data and different ways to record data.  
 
 
Science capabilities: 
Answers/responses: 

Y8 2003 (1999)

Involvement:
  • all students substantially involved
  • one student not substantially involved
 
 
90%  (84%)9%    (14%)
Division of labour:
  • students worked together on all samples
  • informal division of samples within group
  • deliberate allocation to different students
 
 
39%  (26%)
52%  (70%)
9%    (4%)
Reporting results:
  • all had a turn
  • one did not have turn
  • two or more did not have turn
 
 
94%  (92%)
3%    (8%)
3%    (0%)
Style of investigating:
  • highly systematic
  • quite systematic
  • somewhat haphazard
  • very haphazard
  • produced information in chart form
 
 
19%  (7%)
34%  (33%)
39%  (48%)
8%    (12%)
81%  (57%)
Y8 2003 (1999)
Substance A:
  • identified as Ajax
  • 2 or more relevant observations
  • 1 relevant observation
 
 
17%  (7%)
51%  (37%)
19%  (31%)
Substance B:
  • identified as citric drink
  • 2 or more relevant observations
  • 1 relevant observation
 
 
99%  (54%)
69%  (42%)
13%  (27%)
Substance C
  • identified as flour
  • 2 or more relevant observations
  • 1 relevant observation
 
 
75%  (93%)
55%  (44%)
18%  (31%)
Substance D
  • identified as washing powder
  • 2 or more relevant observations
  • 1 relevant observation
95%  (68%)
61%  (44%)
12%  (22%)
Substance E:
  • identified as salt
  • 2 or more relevant observations
  • 1 relevant observation
46%  (73%)
55%  (40%)
14%  (22%)
Substance F:
  • identified as baking soda
  • 2 or more relevant observations
  • 1 relevant observation
38%  (50%)
44%  (44%)
24%  (21%)
Total:
20-22
16-19
12-15
8-11
4-7
0-3


14%  (4%)
35%  (22%)
21%  (20%)
11%  (30%)
15%  (22%)
4%    (2%)
Diagnostic and formative information: 
Commentary
There are surprising fluctuations between 1999 and 2003, with some substances handled much better in 1999 and others in 2003.
Overall, performance was markedly higher in 2003 than in 1999.