Rainfall & temperatures around the world

Rainfall & temperatures around the world

Pencil and paperOnline interactive
Overview
Using this Resource
Connecting to the Curriculum
Marking Student Responses
Working with Students
Further Resources
This task is about reading information off a graph showing rainfall and temperature.
Use the graph below to answer the following questions.
Average rainfall and temperature for Tokyo, Los Angeles and Perth                       
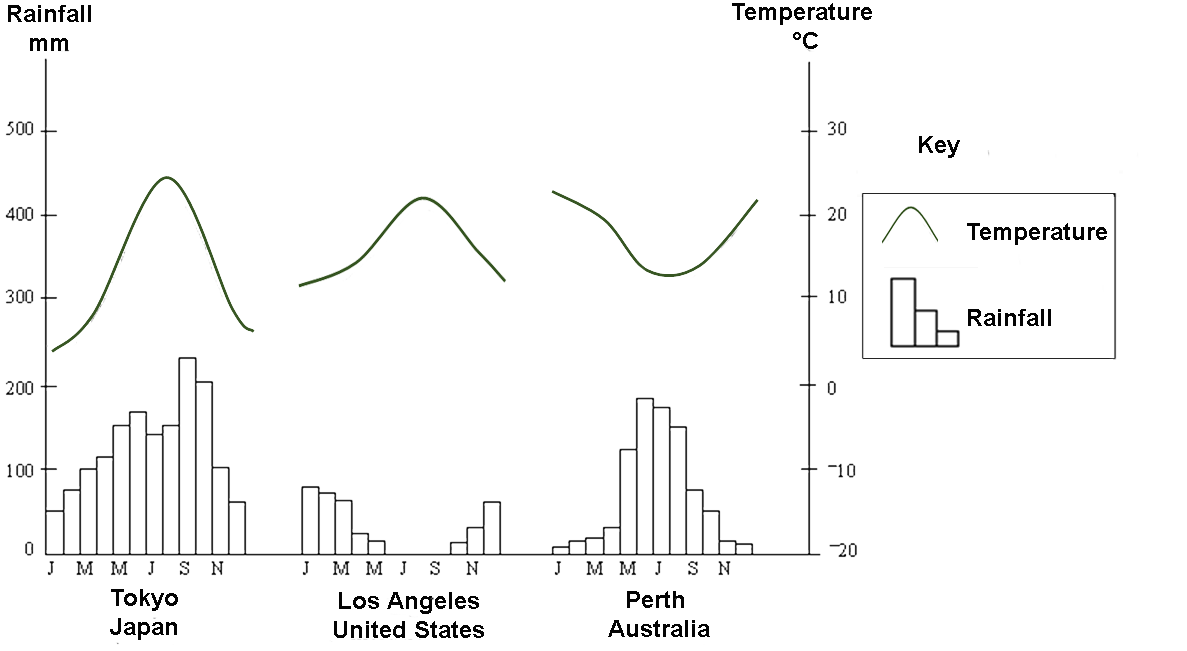
 
graph showing average annual rainfall and temperatures for Tokyo, Los Angeles and Perth

Question 2Change answer

a)  In which month does Tokyo receive most rain? 

Question

b) Which city has the lowest annual rainfall? 
    • Tokyo

    • Los Angeles

    • Perth

Question

c)  When temperatures are warm, and moisture is present, there is usually high humidity.
     Which city is most likely to have high humidity in the month of September?
    • Tokyo

    • Los Angeles

    • Perth

Question 2Change answer

d)  Bush fires can occur around Perth when it is hot and dry.
In which month are bush fires most likely? 

Question 2Change answer

e)  Tokyo and Los Angeles are cities in the Northern Hemisphere.
     Explain how their temperatures show this.
Task administration: 
This task can be completed with pencil and paper or online.
Level:
4
Description of task: 
Students are provided with a graph showing the average rainfall and temperatures for Tokyo, Los Angeles, and Perth. Students interpret this graph to answer a number of questions.
Curriculum Links: 
Science capabilities
The capabilities focus is brought about by the conversations you have and the questions you ask.
 
Capability: Interpret representations
Scientists represent their ideas in a variety of ways, including models, graphs, charts, diagrams and written texts. This resource provides opportunities to discuss reading a complex weather graph.
 
Science capabilities: 
Making Better Sense: 
Answers/responses: 
  Y8 (05/1999)
a) September/S very easy
b) Los Angeles/LA easy
c) Tokyo easy
d) Any 1 of:

  • December
  • January
  • February
moderate
e) Because highest temperatures are around June-August. very difficult
Diagnostic and formative information: 
   Common errors
b) 24% of students answered Perth.
d) The most common wrong months given were June (14%), and May (5%).