Spheres and cubes

Spheres and cubes

Pencil and paper
Overview
Using this Resource
Connecting to the Curriculum
Marking Student Responses
Further Resources
This task is about fair testing and plotting results from a data table.
An experiment was set up to compare the rate of cooling of a plasticene sphere and a plasticene cube.
This is what was done:
  • Four shapes were made out of plasticene; two cubes and two spheres.
  • A thermometer was pushed inside each shape to measure the temperature throughout the experiment. (See the diagrams below).
  • A container of hot water was used to heat up the shapes.
  • The shapes were removed from the hot water and allowed to cool for 25 minutes.
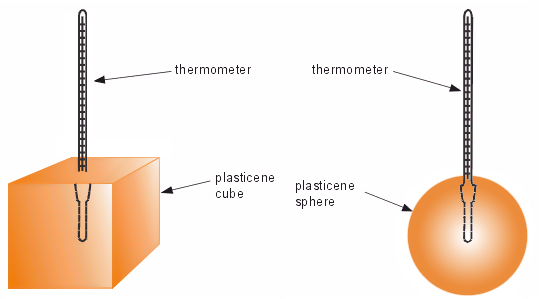
 

diagram of a thermometer in a plasticene cube and a thermometer in a plasticene sphere

 
a)
Why were two of each shape used?


b)
What are three variables that should have been kept the same in this experiment?


c)
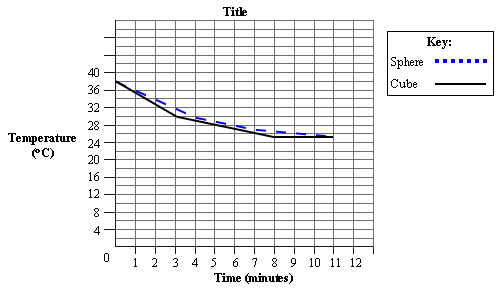
The results of the experiment are shown on the table below.
Use the data to plot a graph of the results. 


Time (minutes)

0

1

2

3

4

5

6

7

8

9

10

11

Sphere
temp °C

38

36

34

32

30

29

28

27

26.5

26

25.5

25

Cube
temp °C

38

35.5

33

30.5

29

28

27

26

25.5

25

25

25


d)
Explain the results.


Task administration: 
This task can be completed with pencil and paper only.
Level:
5
Description of task: 
Students are given an outline of an investigation on heat loss from two different shaped objects (a cube and a sphere). They answer questions on variable control, repeat trialling, and they then graph data from this investigation.
Curriculum Links: 
Science capabilities
The capabilities focus is brought about by the conversations you have and the questions you ask.
 
Capability: Critique evidence
This resource provides opportunities to discuss whether the data gathered provides evidence for the conclusions drawn.
 
Capability: Interpret representations
This resource provides opportunities to discuss how to plot and read information on a graph.
Answers/responses: 
 

Y10 (10/2001)

a)

Any 1 of: 

  • For repeat trials.
  • In case there was a mistake (or similar).
moderate
b)

Any 3 of: 

  • Initial temperature (of cubes and spheres).
  • Mass/volume/amount of plasticene.
  • Same environmental conditions for cooling.
  • Thermometer inserted to same depth in plasticene each time.

3 correct - very difficult
2 correct - difficult
1 correct - easy

c)

Graph to have the following:

  • Title.
  • x-axis labelled with unit and has a scale.
  • y-axis labelled with unit and has a scale.
  • Key or lines labelled.
  • The graph drawn is a line graph.
  • Data plotted correctly. 


moderate
easy
easy
very easy
easy
Both correct - moderate
1 correct - very easy

d) Because the cube has a greater surface area. difficult