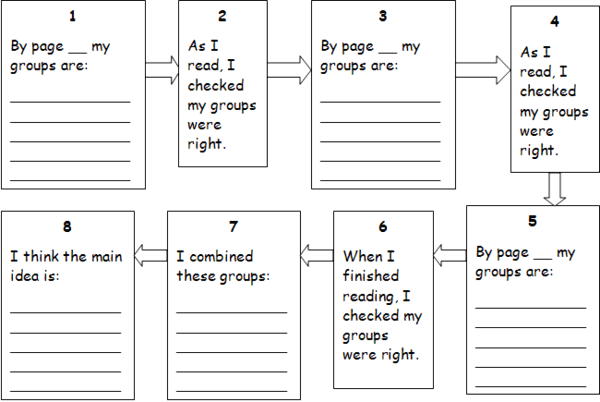
Flow charts are one type of graphic organiser where students’ thinking can be made visible. Creating a flow chart from oral, visual, and written texts can help students think, and reflect on their thinking. Flow charts visually represent textual relationships that are linked by time. In creating a flow chart, students describe a sequence of events, stages, phases, or actions that lead to an outcome.
The theory
The use of graphic organisers has been found to improve reading comprehension at all levels and across content areas. The National Reading Panel (2000) cited the use of graphic organisers as being one of the seven most effective instruction strategies for improving reading comprehension. Flowcharts were introduced in the 1940/50s and popularised in the 1970s, particularly in the business sector.
When to use
A flow chart can be used formatively or summatively to assess student understanding of:
the stages in a linear process, e.g.,
- a plan to save up for a new iPod;
- how a permanent change comes about;
- how butter is made;
- how an acid becomes neutralised.
a sequence of events or actions, e.g.,
- how a conflict came about;
- what lead to a character’s downfall.
How the strategy works
When students create (or fill in a blank) flow chart, their thinking about the following will be made explicit:
- their understanding of the initiating event and subsequent events, ie., their ability to rank;
- their understanding of the stages in the process, i.e., their ability to order;
- their understanding of how the stages are connected, i.e., their ability to link; and
- their understanding of the goal or final outcome, i.e., their ability to conclude.
What to do
Example: Finding the main idea of a text.
To establish the main idea of a text, students need to work through the following stages. As students read, they:
- Group details that appear to be important to the text.
- Check that their groups are still the right ones. If their groups aren’t, students make new groups.
- Continue to add details to their groups and check that the groups and the details in them are the right ones.
When students have finished reading, they:
- Check that all their groups and the details in them are the right ones.
- Combine the groups in order to establish the main idea.
When assessing students’ understanding, you may wish to:
- ask them to construct their own flow chart outlining the stages they go through. Note that no two people will go through the exact same stages; or
- ask them to complete a flow chart while they are reading, such as the following:

N.B. Boxes 1, 3, and 5 are to be filled in according to where significant points of the text are reached.
While the flow chart above is presented as a linear process, finding the main idea is never truly linear, just as thinking is not. No two students will approach the thinking in the same way. If the text has a high reading load, recognise that this process is about comprehension, not decoding, and read it aloud to students. If the text is long, this process can become laborious. Either do some of the work for students yourself, or:
- spread the lesson over a number of sessions;
- have groups or individuals take responsibility for analysing particular sections of text; then integrate those sections as a whole group exercise (e.g., Jigsaw learning).
Using flow charts in general
Creating flow charts can over-simplify a process. Other forces can affect a linear process, and on a sequential flow chart, these forces will not necessarily be depicted. It is also important to recognise that for a student who clearly understands a process or sequence, filling in a flow chart may be a pointless and frustrating exercise.
Examples of ARB resources where flow charts could be applied
Click on the key word permanent change in the science bank.
The links below are from the English bank. They assess the comprehension strategy of identifying the main idea. Note that these are all scaffolded tasks so parts of the process have already been done for students. Teachers may wish to apply the above flow chart model to the texts used in these resources.
References
- Cubitt, S., Irvine, R. & Dow, A. (1999). Top Tools for Social Science Teachers. Pearson Education New Zealand Ltd, Auckland.
- Fountas, I.C. & Pinnell, G.S. (2001). Guiding Readers and Writers: Grades 3-6. Heinemann, Portsmouth, NH.
- National Reading Panel, 2000. Teaching Children to Read: An evidence-based assessment of the scientific research literature on reading and its implications for reading instructions [pdf]
Examples of ARB resources where flow charts are constructed by the students

