Reading graphs
0
Overview
Using this Resource
Connecting to the Curriculum
Marking Student Responses
Working with Students
Further Resources
This task is about reading information from graphs.
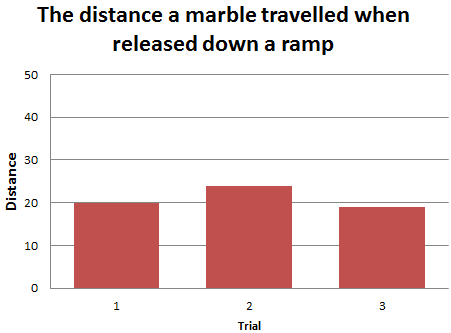
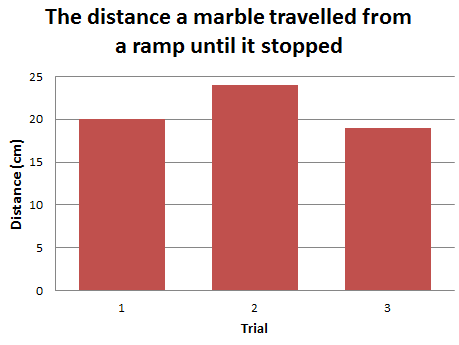
Sienna and Wiremu's team rolled a marble down a ramp three times. They measured the distance from the bottom of the ramp to where each marble stopped. They wrote the results in the data table below.
| Trials | Distance marble travelled |
| 1 | 20 centimetres (cm) |
| 2 | 24 centimetres (cm) |
| 3 | 19 centimetres (cm) |

Wiremu's graph
|

Sienna's graph
|

Wiremu's graph
|

Sienna's graph
|

Wiremu's graph
|

Sienna's graph
|
Task administration:
This task can be completed with pencil and paper or online with SOME auto-marking.
Level:
3
Curriculum info:
Key Competencies:
Keywords:
Description of task:
Task: Look for the similarities and differences in how students draw graphs to display information.
Curriculum Links:
Science capabilities
The capabilities focus is brought about by the conversations students have and the questions they ask.
Capability: Interpreting representations
This resource provides opportunities for students to discuss how graphs convey information about how an investigation was carried out and the data obtained.
Science capability: Interpreting representations (Tāhūrangi)
Capability: Critique evidence
This resource provides opportunities for students to discuss whether the data gathered provides evidence for the conclusions drawn.
Science capability: Critique evidence (Tāhūrangi)
Science capabilities:
Answers/responses:
| Questions | Student responses |
|
Henri wrote that both graphs:
a) Is there anything that was the same in both the graphs that Henri missed? Yes/No
Explain why you think this.
|
Yes
Explanation that both graphs have:
|
|
b) Is there anything that is different in both graphs? Yes/No
Explain why you think this.
|
Yes
Explanation:
|
|
c) Which is the easier graph to read? Wiremu's/ Sienna's
Explain why you think this.
|
Sienna's
Explanation:
|
Diagnostic and formative information:
| Questions | Student explanations |
|
Henri wrote that both graphs:
a) Is there anything that was the same in both the graphs that Henri missed? Yes/No
Explain why you think this.
|
In science it is important to pay attention to similarities as well as differences. This resource focuses on students focussing specifically on similar or different features of two graphs.
Most students did focus on similarities, e.g., they recognised that both graphs had a title, the same number of trials and the same results/data. Some also said the width of the bars and the title on the x-axis, e.g., Trial were the same.
However some students used differences (instead of similarities), e.g.,
Some students also attended to things that were not relevant science features, e.g., colour
|
|
b) Is there anything that is different in both graphs? Yes/No
Explain why you think this.
|
Students found focussing on differences easy, with most students recognising the unit (cm), title and scale on the y-axis as different in both graphs.
However, many students did not support/explain their choice, e.g.,
or compare the graphs in their explanation, e.g.,
or used non-science (imprecise) ways of describing, e.g.,
Many students could not read the intervals/scale of the graphs correctly, e.g.,
even when they recognised the scales were different, e.g.,
|
|
c) Which is the easier graph to read? Wiremu's/ Sienna's
Explain why you think this.
|
When critiquing evidence it is important for students to look carefully at all the data/evidence given and decide if it supports the statements/conclusions made.
Most students correctly identified that Sienna's graph was easier to read because of the scale.
However a small number of students read the graphs as two seperate investigations, e.g.,
or related a missing piece of evidence as important, e.g.,
Some students noted the difference in the scale but not why this made a difference, e.g.,
|
Based on 87 students completing the test on-line.
Next steps:
Capability 4: Interpreting representations
Scientists represent their ideas in a variety of ways, including models, graphs, charts, diagrams and written texts. Students need to know quite a lot about science knowledge to be able to interpret/understand all the information a graph is telling us. To support students to test their understandings about the quality of representations, give them opportunities to compare/review each others representations. Get them to ask:
- how much of the data is represented?
- what data is missing?
- can they see a pattern/patterns in the representation?
- is sufficent relevant data being shown?
Capability 3: Critiquing evidence
In order to evaluate the trustworthiness of data, students need to know quite a lot about the qualities of scientific tests/investigations. To support students to test their understandings about the qualities of scientific explanations, give them opportunities to ask each other questions about their investigations/pattern seeking.
- Can they decide if the evidence/data given supports the explanation/conclusion?
- Is there any data missing?
- Is the evidence/data of sufficient quality to support the explanation/conclusion?
The following Level 3 ARB resources are based on Capability 3: Critiquing Evidence and/or Capability 4: Intepreting representations of the Nature of Science.
They focus on pattern seeking, the trustworthiness of data and/or what information graphs tell us.

