Where was the earthquake?

Where was the earthquake?

Pencil and paper
Overview
Using this Resource
Connecting to the Curriculum
Marking Student Responses
Further Resources
This task is about calculating and plotting data to find the epicentre of an earthquake.

An earthquake struck central New Zealand at about 11:23 a.m. yesterday morning. The time difference between the arrival of the P and S waves can be used to find the epicentre of this earthquake.

  Relationship between time difference and distance
Time between P and S waves (seconds) 12 15 18 22 26 30 35 37
Distance (km) 100 120 150 175 200 270 325 350
 
a)
 
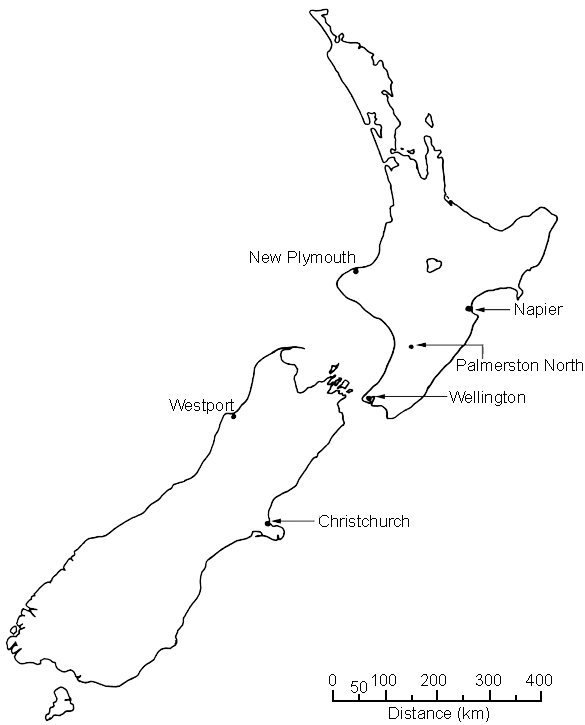
Use this information to complete the table below which shows data collected from seismographs in three different cities.
 
Location Arrival time of waves Time difference (s)  Distance (km)
P wave (h:m:s) S wave (h:m:s)
Wellington 11:23:27  11:23:45        
Westport 11:23:30  11:23:52        
Napier 11:23:52  11:24:27    
   
b)
Use the distances you calculated, and the scale, to show where the epicentre of the earthquake was located. Use a compass to find this point and mark on the map with an X.
 
map-aotearoa-new-zealand.png
Task administration: 
This task can be completed with pencil and paper.
Level:
5
Description of task: 
Using data from three different locations, students calculate the time difference between the arrival of P and S waves and the distance of each location from an earthquake's epicentre. Students use these distances to locate the epicentre on a map of NZ.
Curriculum Links: 
Science capabilities
The capabilities focus is brought about by the conversations you have and the questions you ask.
 
Capability: Interpret representations
Scientists represent their ideas in a variety of ways, including models, graphs, charts, diagrams and written texts. This resource provides opportunities to discuss different ways of interpreting and plotting science information e.g., earthquake data.

Science capability: Interpret representations (TKI)

 
Science capabilities: 
Answers/responses: 
 

Y10 (06/2000)

a)


(s)

(km)

Wellington

18

150

Westport

22

175

Napier

35

325

3 correct – easy

2 correct – very easy

1 correct – very easy

b)

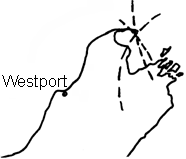
Point marked east of Golden Bay area as shown, or very close to one shown.

Map

moderate

 
moderate