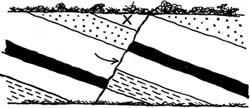
Fault line
0
Overview
Using this Resource
Connecting to the Curriculum
Marking Student Responses
Working with Students
Further Resources
This task is about layers of rock.
Task administration:
This task can be completed with pencil and paper or online.
Copyright:
Graphic: copyright NZCER
Level:
5
Curriculum info:
Keywords:
Description of task:
Students are provided with a diagram of a roadside cutting. They are asked to mark the fault line and the youngest rock layer in this cutting. Students then suggest two explanations for the pattern shown in the diagram.
Curriculum Links:
Science capabilities
The capabilities focus is brought about by the conversations you have and the questions you ask.
Capability: Interpret representations
Scientists represent their ideas in a variety of ways, including models, graphs, charts, diagrams and written texts. Scientists represent their ideas in a variety of ways, including models, graphs, charts, diagrams and written texts. This resource provides opportunities to discuss:
- noticing patterns in data shown in a diagram
- the evidence provided in a diagram that can be used to make inferences.
Science capabilities:
Answers/responses:
|
|
Y10 (06/2000) |
||
|
a) |
i) |
|
very easy |
|
b) |
Any 2 of:
|
2 correct – very difficult
1 correct – easy |
|
Diagnostic and formative information:
| Common error | |
|
a) ii) |
14% of students indicated the top layer on the right hand side. |
|
b) |
Analysis of correct responses:
|


