Graphing dice throws

Graphing dice throws

Pencil and paper
Overview
Using this Resource
Connecting to the Curriculum
Marking Student Responses
Working with Students
This task is about the best type of graph to show different data.
a)  Sivendra threw a dice 50 times and wrote down the number that was facing up after each throw.
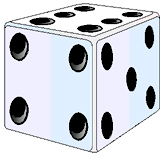
  What kind of graph would be best to display this data?
 
  (A)
(B)
(C)
(D
Bar graph
Line graph
Box-and-whisker graph
Stem-and-leaf graph
 
 
b)  Petra chose a histogram to graph the heights of people in her younger sister's class.

  Why is a histogram the best kind of graph to display this type of data?


Task administration: 
This task is completed with pencil and paper only.
Level:
5
Description of task: 
Students identify the appropriate type of graph for a statistical investigation about dice throws. They also justify the use of a histogram for an investigation about heights of people, indicating their understanding of discrete and continuous data.
Learning Progression Frameworks
This resource can provide evidence of learning associated with within the Mathematics Learning Progressions Frameworks.
Read more about the Learning Progressions Frameworks.
Answers/responses: 
 

Y10 (05/2000)

a) A - Bar graph difficult
b)

Any 1 of:
Histograms are used for:

  • continuous data.
  • data that can assume any value.

[Answers will vary.]

very difficult
 
For more information about discrete and continuous, click on Types of data: Statistics
Diagnostic and formative information: 
Common error
a)  Over half of the students selected option "D" - Stem-and-leaf graph.