New Zealand rainfall

New Zealand rainfall

Pencil and paper
Overview
Using this Resource
Connecting to the Curriculum
Marking Student Responses
Working with Students
Further Resources
This task is about reading a climate map and creating a graph.
a)
Which of the named places receives the most rainfall in the
 
  i)
 
ii)
North Island? ____________________
 
South Island? ____________________
 
b)
Write a statement which compares rainfall on the West Coast of the South Island, with rainfall on the East Coast of the South Island.


c)
From the key, what description is given for the annual average rainfall in millimetres for the area in which you live?
 
  (A)
(B)
(C)
(D)
(E)
Very wet
Wet
Average
Dry
Very dry


d)
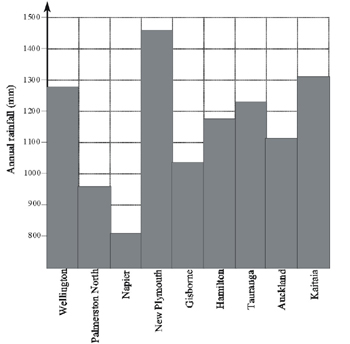
Complete this bar graph for the annual rainfall of the North Island places marked on the map.


Task administration: 
This task can be completed using pencil and paper.
Level:
4
Description of task: 
Students are provided with a map of NZ showing the average annual rainfall in different areas. Students interpret this information to answer three short answer questions, and then construct a bar graph that shows the rainfall for nine North Island locations.
Curriculum Links: 
Science capabilities
The capabilities focus is brought about by the conversations you have and the questions you ask.
 
Capability: Interpret representations
Scientists represent their ideas in a variety of ways, including models, graphs, charts, diagrams and written texts.
This resource provides opportunities to discuss the particular information best portrayed by the map or the graph.
 
 
Science capabilities: 
Making Better Sense: 
Answers/responses: 
  Y8 (05/1999)
a) i)
ii)
New Plymouth
Milford Sound
moderate
very easy
b)    A statement such as "The West Coast receives more rain than the East Coast" (or reverse of). easy
c)    Answers will vary. easy
d)    all bars plotted correctly – moderate

1 error – easy

Diagnostic and formative information: 
   Common errors
a) i) 18% of students gave Gisborne as the answer.