Ozone hole over Antarctica

Ozone hole over Antarctica

Pencil and paper
Overview
Using this Resource
Connecting to the Curriculum
Marking Student Responses
Further Resources
This task is about reading information from a graph.
Each year an ozone hole develops over Antarctica. An ozone hole is defined as an area in which the concentration of ozone is less than 220 Dobson Units. The following data was recorded in one year.
 
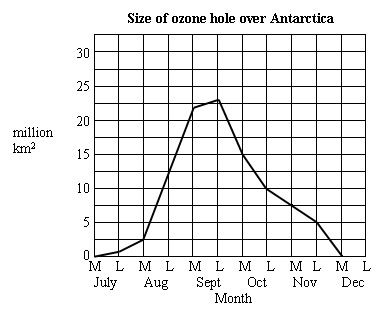
Size of Ozone Hole in Millions of Square Kilometres by Month
Month
Mid
July
Late
July
Mid
Aug
Late
Aug
Mid
Sept
Late Sept
Mid
Oct
Late
Oct
Mid
Nov
Late
Nov
Mid
Dec
Size of ozone hole
(million km2)
0
1
3
12
22
23
16
11
 
8
4
0
 
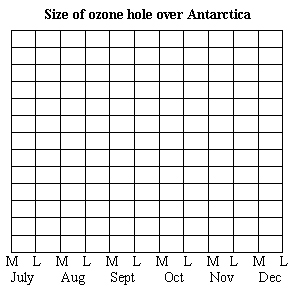
a) Draw a line graph for this data on the grid below. Put in the measurement units.
  graph
b)
When does the ozone hole first appear? ______________________
 
c)
Write a statement summarising what the graph shows.
 
______________________________________________________________________
 
______________________________________________________________________
 
______________________________________________________________________
 
d)
Sometimes an ozone hole develops faster, covers the same area, and disappears more slowly than the ozone hole you graphed above. Draw a line on your graph (in a different colour) to show this.
 
e) Give two reasons why the development of an ozone hole is of concern to New Zealanders.

 
1. _____________________________________________________________
 
2. ____________________________________________________________
Task administration: 
This task can be completed with pencil and paper.
Level:
5
Description of task: 
This assessment task requires students to graph data on the size of the ozone layer over Antarctica. Students then answer four short questions relating to the data and their graph.
Curriculum Links: 
Science capabilities
The capabilities focus is brought about by the conversations you have and the questions you ask.
 
Capability: Interpret representations
Scientists represent their ideas in a variety of ways, including models, graphs, charts, diagrams and written texts.
This resource provides opportunities to discuss the relative benefits of using tables or graphs to convey the same set of data.
Science capabilities: 
Answers/responses: 


Y10 (08/2001)

a)

Line graph drawn.
y-axis labelled and an appropriate scale used.
All points correctly plotted.
1 error in plotting made.


very easy
difficult
very easy
 

b)

(Late) July

very easy

c)

Correct and complete statement made,
e.g., "The ozone hole increases in size until late September then decreases."

moderate

d)

The line begins at July and rises more steeply than the graphed line.
The line reaches the same height, and returns, but with a less steep gradient, (i.e., doesn't need to return to zero in December).

moderate 
moderate

e)

Any 2 of: 

  • Because it/the ozone hole moves over NZ.
  • Because ozone filters out U.V. light.
  • Because U.V. light can cause skin cancer/cataracts/sun burn.
  • Other acceptable answers.

2 correct -
very difficult
 
1 correct -
moderate