
A Venn diagram is a type of graphic organiser. Graphic organisers are a way of organising complex relationships visually. They allow abstract ideas to be more visible.
Although Venn diagrams are primarily a thinking tool, they can also be used for assessment. However, students must already be familiar with them before they can be used in this way.
When to use
Venn diagrams are used to compare and contrast groups of things.
They are a useful tool for formative assessment because they:
-
can be used to generate discussion; and
- provide teachers with information about students’ thinking.
In science, they are helpful for classification.
As an accepted convention for representing similarities and differences, knowing how to use them contributes to the Key Competency, Using language, symbols, and texts.
The theory
Venn diagrams originate from a branch of mathematics called set theory. John Venn developed them in 1891 to show relationships between sets. They are now used across many other disciplines.
Information is usually presented to students in linear text. Especially when there is a lot of information, it is difficult to see relationships in this format. Venn diagrams enable students to organise information visually so they are able to see the relationships between two or three sets of items. They can then identify similarities and differences.
How the strategy works
A Venn diagram consists of overlapping circles. Each circle contains all the elements of a set. Where the circles overlap shows the elements that the set have in common. Generally there are two or three circles. Any more and the exercise becomes very complicated.
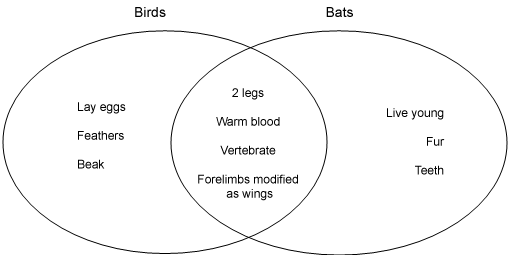
The following science example compares the features of bats and birds.
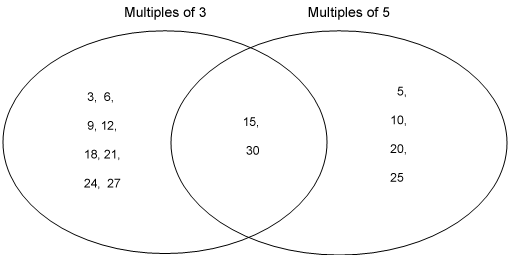
The following is a maths example:
What to do
Creating a Venn diagram
If the assessment focus is on organising information:
-
Students view written text, pictures, diagrams, or video/film about two (or sometimes three) items that have some related characteristics.
-
Identify what items they want to compare (e.g., birds and bats).*
-
Draw two overlapping circles. Label each circle (Bird, Bat).
-
In each circle, fill in the characteristics of each item.
-
Identify which characteristics appear in both circles. These characteristics go in the intersection (where the two circles overlap).
-
Sometimes features that don't fit in either set are included. E.g., in the maths example, if all numbers between 1 and 30 were included, some would not be a multiple of either 3 or 5. These are placed outside the circles.
It is preferable that students then use their Venn diagram to compare the sets.
*Sometimes the first step is to draw a rectangle and identify the universal set. For example, in the science example above, the universal set might be Animals that fly. The circles for birds and bats are then drawn inside the rectangle.
Reading a Venn diagram
If the assessment focus is to interpret a Venn diagram:
-
Ask questions about the similarities and differences that the Venn diagram illustrates.
-
Provide true/false statements, e.g., 10 is a multiple of 3 and 5.
-
Ask questions about, or discuss the two sets. For example, students may be able to say that bats have some similarities to birds, but are not birds because they don't lay eggs or have feathers.
-
If appropriate, ask questions that encourage students to make generalisations, e.g., Can we classify a bat as a member of the bird family?
Limitations
When trialling ARB resources we have found that many students do not use Venn diagrams well. Some are unfamiliar with them. If using Venn diagrams as an assessment strategy, students must have already demonstrated that they know how they work, to ensure that the assessment is valid.
Adapting the strategy
- Venn diagrams are widely used as a tool for thinking. They are therefore also a useful teaching strategy.
- They can be useful for practising making logic statements, e.g., if/then, all/some/no, may be.
- When teaching students about Venn diagrams, or working with young students, use concrete materials, such as post-its, cards, string, or hoops, which students can move around.
- Computer programmes such as Inspiration are useful for creating Venn diagrams.
Examples of ARB resources that include Venn diagrams [login required]