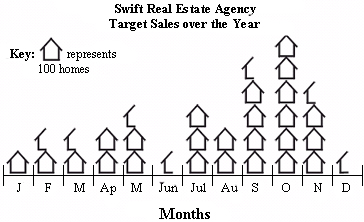
House sales

|
Month |
Jan |
Feb |
Mar |
Apr |
May |
Jun |
Jul |
Aug |
Sep |
Oct |
Nov |
Dec |
|
Target Sales |
100 |
150 |
150 |
200 |
250 |
50 |
300 |
200 |
450 |
600 |
350 |
50 |
The table above shows the number of houses the Swift Real Estate Agency are hoping to sell during each month over the next year.
Use the data shown in the table above to construct a pictograph in the space below.
Remember your graph will need:
- a title,
- clear labels, and
- a key.


