Melting ice cubes

Melting ice cubes

Pencil and paper
Overview
Using this Resource
Connecting to the Curriculum
Marking Student Responses
Further Resources
This task is about investigating melting.
How to do this task 
  • Get two paper towels.
  • Use a ruler and biro to draw squares which are 2 cm × 2 cm.
  • Place one paper towel in a flat warm place, and the other in a flat colder place.
  • Place an ice cube in the middle of each paper towel.
  • Draw around the edge of the water stain after 5 minutes. Repeat this after 10 minutes and 15 minutes.
a)
Complete the chart of your results.
Remember that the number of squares covered by water after 10 minutes includes those squares covered after 5 minutes. 
 
 
Time
Paper towel in warm place 
(Number of squares covered by water)
Paper towel in colder place 
(Number of squares covered by water)
5 minutes    
10 minutes    
15 minutes    
 
 b)
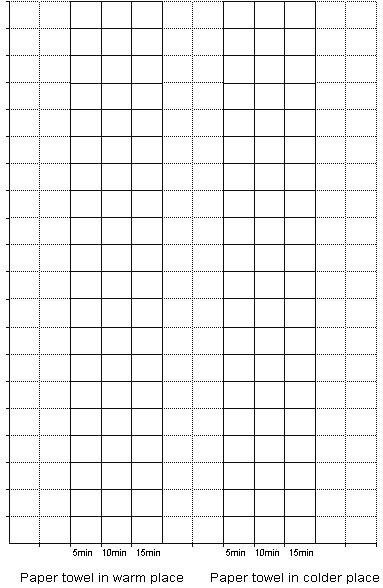
Finish each graph by colouring in the number of squares that were wet on each paper towel.
 
  empty graph


c)
Look at both graphs. Describe the main difference between the graphs.


d)
Explain why there was a difference in your results.


Task administration: 
This task can be completed with pencil and paper and other other equipment.
 
Equipment:
Paper towels; water; 2 × ice cubes of the same size (could be coloured with food dye); clock or watch; biro.
  • We drew vertical and horizontal lines which were 2 cm apart to get squares which measured 2 cm × 2 cm. A biro is best for doing this. You may like to have a sample sheet drawn up.
  • If doing this activity in winter you will require warm and cold areas and may need to alter the times at which measurement of melting is carried out. For a warm area we used the classroom, while a colder area was one outside in the shade (winter conditions).
  • You may need to explain to students how they should count the squares. This will include making an estimate for partially covered squares.
Level:
3
Description of task: 
This practical task assesses students' ability to record and graph data, and draw conclusions, as they conduct an experiment on the rate at which an ice cube melts in different temperatures.
Curriculum Links: 
Science capabilities
The capabilities focus is brought about by the conversations you have and the questions you ask.
 
Capability: Gather and interpret data
This resource provides opportunities to discuss making decisions about the best way to collect data to answer a question.
Science capabilities: 
Making Better Sense: 
Answers/responses: 
a) Chart completed.
b)

Graphs drawn correctly from their data.

c) A valid difference from their graphs made, e.g., The water covered more squares on the paper towel which was in the hot area.
d) Because the heat/warmer temperature made the ice melt faster.