Students read from, and mark points on, non-linear scales.
Answers/responses:
Y10 (05/2007)
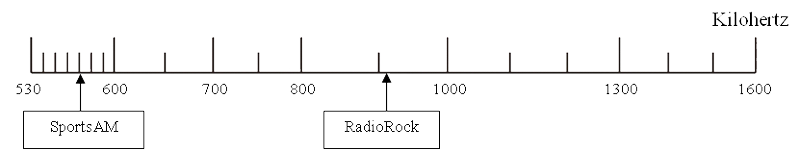
a)
i)
ii)
570 [Accept 570 to 572]
910 [Accept 905 to 915]
Plotted between 1340 - 1360
very easy
easy
easy
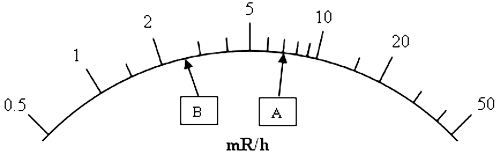
b)
i)
ii)
7 [Accept up to 7.1]
2.5 [Accept 2.4 to 2.7]
Plotted between 34 and 36
easy
moderate
easy
Based on a representative sample of 165 students.
Teaching and learning:
Scales
Not all scales are evenly spaced. Scales with unevenly spaced intervals are called "non-linear scales". Two examples of these are given in the questions, namely the markings on an AM radio dial, and the measure of radiation in mR/h. Other examples include the Richter scale for earthquake magnitude, or decibels which is the measure of noise intensity. Both of these are logarithmic scales, but neither are base-10 logarithms.
The non-linearity of the scale often reflects the physical properties of what is being measured. If a linear scale were used for earthquakes, the numbers would quickly get extremely large and cumbersome. An earthquake of 8 on the Richter scale is nearly a million times more powerful than one of magnitude 4. The aperture scale on a camera (f4, f5.6, f8, f11 etc.) is also non-linear, but in this case the larger the f-number, the less light is let into the camera. Older spring-operated bathroom scales are non-linear, as the spring compacts more slowly at higher weights, so the tick-marks get closer together.
Diagnostic and formative information:
Common error
Likely misconception
a) i)
a) ii)
b) i)
b) ii)
53.4, 534 etc.
800.6, 850.2, 860, 901 etc
1310
5.2, 5.4 etc.
24 etc.
3.5 etc.
Place value error. Does not give appropriate place value magnitude to minor tick marks.
a) i)
a) ii)
b) i)
b) ii)
530
900
1300
5
2
30
Reads or plots point to the nearest major tick mark.
a) ii)
b) i)
b) ii)
Plotted at 1330 (or 1340)
2.75 (or 2.7)
Plotted at 32, 33 (or 34)
Insufficient accuracy. This may indicate that the student interpolates as if the scale is linear rather than non-linear.
Next steps:
Place value errors:
Students should be encouraged to write the correct place value amount below the relevant tick marks. For example, the tick mark between 800 and 1000 is 900 rather than 810 or 850.
If they are still unclear, further investigations about their place value knowledge. For ARB resources to help assess this, click on the link or use the keyword place value.
Plotting to nearest tick mark:
Students should be encouraged to interpolate between given tick marks. They can pencil in smaller intermediate tick marks between the given marks and use these to estimate the actual reading.
Insufficient accuracy:
Students may not have put in intermediate tick marks between the given ones, or do not realise that these intermediate marks are not equally spaced, but get closer together on a non-linear scale.
 and
and