Plant height

Plant height

Pencil and paper
Overview
Using this Resource
Connecting to the Curriculum
Marking Student Responses
Further Resources
This tasks requires you to construct a time series graph.
Ben planted a small lettuce plant and measured its height with a millimetre ruler, at the same time each day.
His results are in the table below.
 
Day Height (mm)
1 10
2 13
3 15
4 20
5 30
6 33
7 35


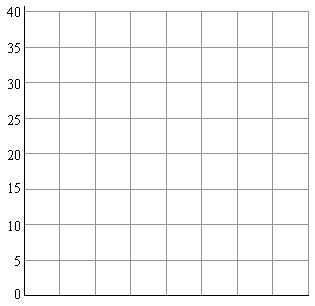
Use Ben's results to draw a line graph on the grid below. 
  • Give your graph a title.
  • Label your graph.
  • Write in any missing numbers.


Task administration: 
This task is completed with pencil and paper only.
 
Level:
3
Description of task: 
Students complete a line graph to show the daily height of a lettuce plant, giving their graph a title and labelling both axes.
Curriculum Links: 

This resource can be used to help to identify students' ability to construct a time-series graph.

Learning Progression Frameworks
This resource can provide evidence of learning associated with within the Mathematics Learning Progressions Frameworks.
Read more about the Learning Progressions Frameworks.
Answers/responses: 
   Y7 (03/2001)
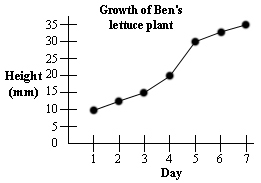
Title that refers in some way to the growth/height/rate/progress of plant, e.g., "Height of lettuce plant", "How high Ben's lettuce plant grew." [NOTE: Do not accept "Ben's Lettuce Plant", etc.]
Labels written in: Day (x-axis), Height (y-axis).
Days 1 to 7 numbered evenly on x-axis.
Points plotted accurately.
Points connected in a line. [Do not penalise student for drawing a line from 0 to 10.]
difficult
 
difficult
easy 
easy
difficult